Restaurant market study and canvas for Excel
Test a restaurant idea on paper before you spend. Estimate the covers the area can send you, compare competitor prices, fill the Business Model Canvas, add the investment and get a payback figure and a go / no-go score.
- Format
- .xlsx workbook (Excel)
- Works with
- Microsoft Excel, desktop or 365
- Capacity
- 9 sheets: demand model, 10 competitors, canvas, scorecard
- Language
- English, French, Spanish, German, Arabic
- Licence
- One business
- Status
- Instant digital download
What you get
Demand model for your area
Residents, workers and visitors, their meals out and your realistic capture rate give covers per day and monthly revenue.
Competitor table and price position
Prices, seats and ratings of nearby places, and where your average spend sits against them.
Customer segments and SWOT
Who will sit at your tables, what they need and how to reach them, then strengths, weaknesses, opportunities and threats.
Business Model Canvas for a restaurant
The nine blocks with a short prompt in each, written for restaurants and filled with an example.
Investment, funding and payback
Opening costs, funding gap, break-even revenue and covers, rent as % of revenue and payback in months.
Go / No-Go scorecard
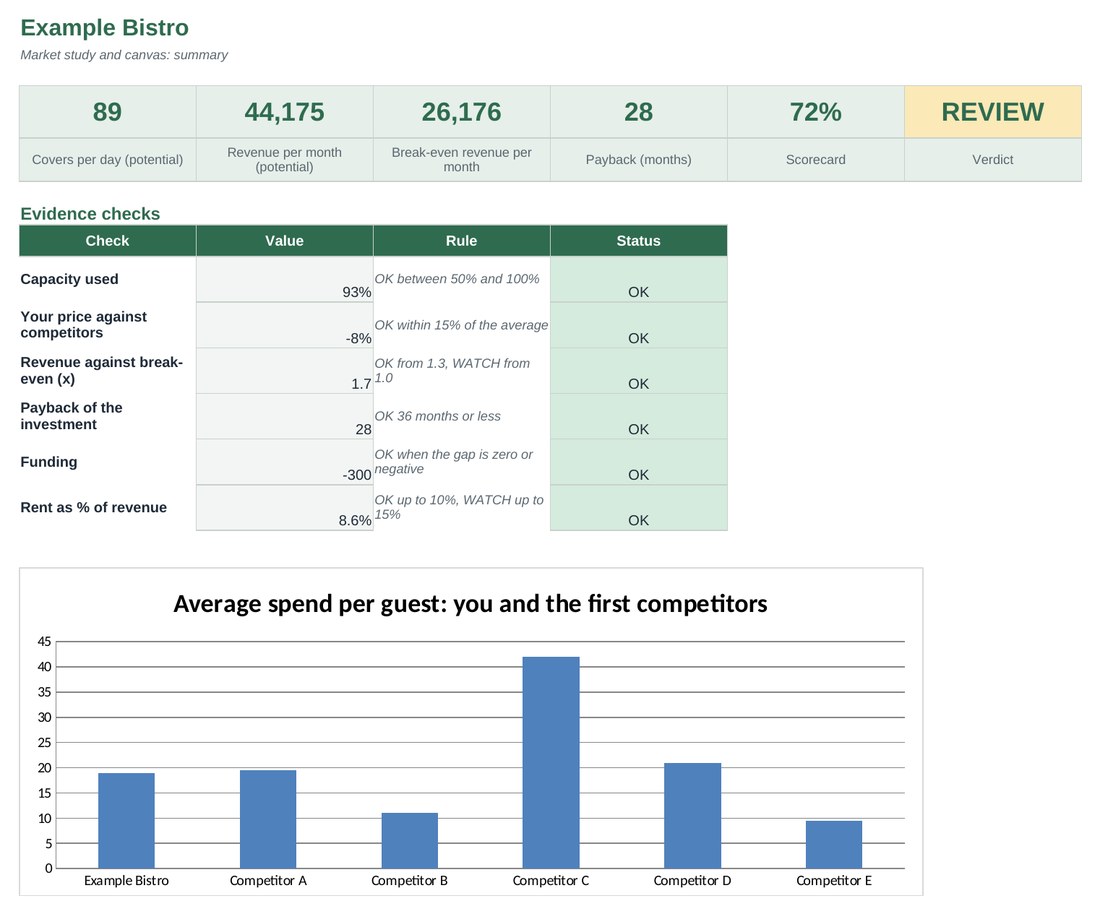
Twelve weighted criteria give a score and a verdict, and the Dashboard adds six evidence checks.
Inside the workbook
Planning tool, not accounting, tax or legal advice. Example data is invented.
| Sheet | What it does |
|---|---|
| Area & Demand | Catchment, demand model, seats and potential revenue |
| Competitors | Competitor table, price position, seats per 1,000 residents |
| Customers | Guest segments, spend and weighted averages |
| SWOT | Strengths, weaknesses, opportunities and threats |
| Business Canvas | The nine blocks of the Business Model Canvas |
| Viability | Investment, funding, monthly results, break-even and payback |
| Go - No Go | Twelve weighted criteria, score and verdict |
| Dashboard | Key figures, six evidence checks and a price chart |
What the example shows
A 60-seat bistro in an area with 25,000 residents, 8,000 workers and 6,000 visitors a month, with capture rates of 6%, 7% and 4%, gets about 2,325 covers a month: 89 a day, or 44,175 in revenue at a spend of 19. Break-even is 26,176 a month, so potential revenue is 1.7 times break-even and payback is 28 months. The scorecard says 72%: REVIEW.
Questions
Does it replace a professional market study?
No. It gives you structured estimates from your own knowledge of the area. It is a way to test an idea and find the weak points before you commission or spend.
What is the capture rate?
The share of a group’s meals out that you expect to win. It is the most sensitive number in the workbook, so test it low. 3-8% is realistic for a new place in a busy area.
Can I use it for an existing restaurant?
Yes. It works for a repositioning, a second site or a new concept as well as for an opening.
While you wait
The recipe costing spreadsheet and the free food cost calculator are the first tools of the toolkit.